|
In a previous post I talked about how work in progress limits act as a safety net, stopping queues forming. In this post I present data from when this happened in a software delivery team I worked with. Imagine you were measuring journey time between Leeds and Sheffield. If we assumed 50% of space on the motorway was taken up by cars, the motorway might feel busy, but traffic should flow and the journey take around an hour. Now imagine the motorway space is 95% taken up by cars. The traffic would be crawling. The journey could now be 3 hours, an increase of 200%. The same thing occurs with lead times for software delivery teams. If the team is over utilised, new work can’t enter the system and must queue, causing increases in lead times. The higher the utilisation, the longer the queues, and the longer lead times get, illustrated below. 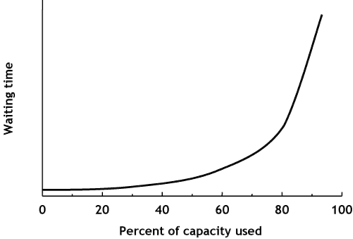 Our team hired new people in February and more developers joined than testers. The new developers were keen to show what they could do and enthusiastically picked up work, exceeding work in progress limits. Seeing these queues visualised on the Kanban board, the rest of the team agreed to not pull more work until levels of WIP returned to normal. The following chart shows the number of work items queued waiting for the next stage in the workflow, the different colours representing the different queues we have, such as waiting for a code review, testing or deployment. There is a spike in queue sizes around the end of February as work in progress limits were exceeded, which returns to normal as the team took action. 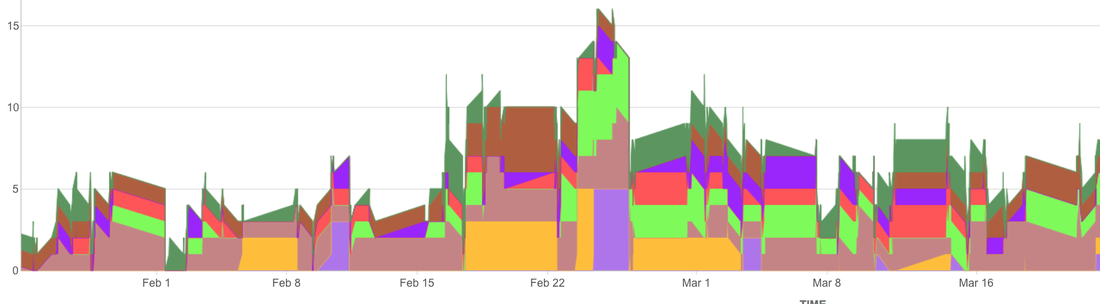 Now compare average lead times during this period, shown by the blue line in the chart below. Around the middle of February, the team had a healthy lead time average of 5 days. This rises to 15 days by the end of February, before returning to 5 days after the team start to manage levels of work in progress again. 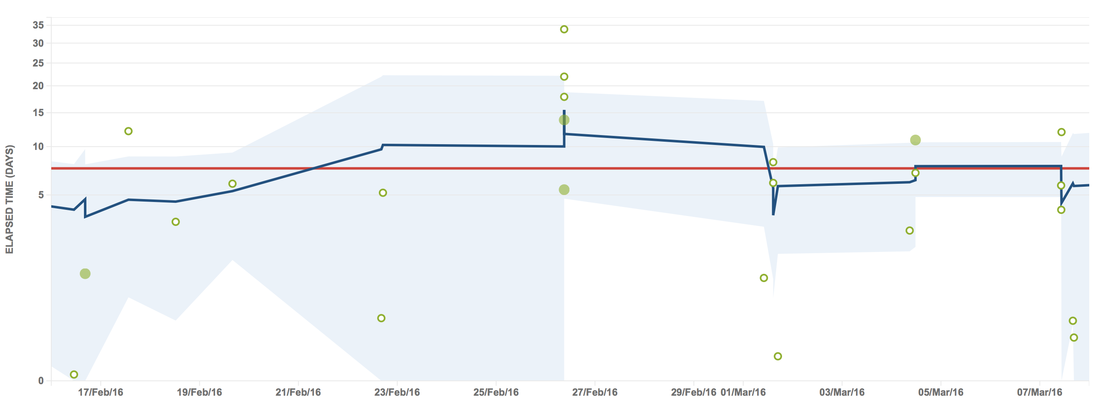 The system is behaving just like the motorway in the analogy. The journey time for a single work item increased by 200% due to the queues in the system. This then returns to normal once the queues reduce. However, the most important thing is the overall effect on throughput, shown in the chart below. To understand this effect, imagine how many cars are actually managing to arrive in Sheffield in both scenarios in the motorway analogy. 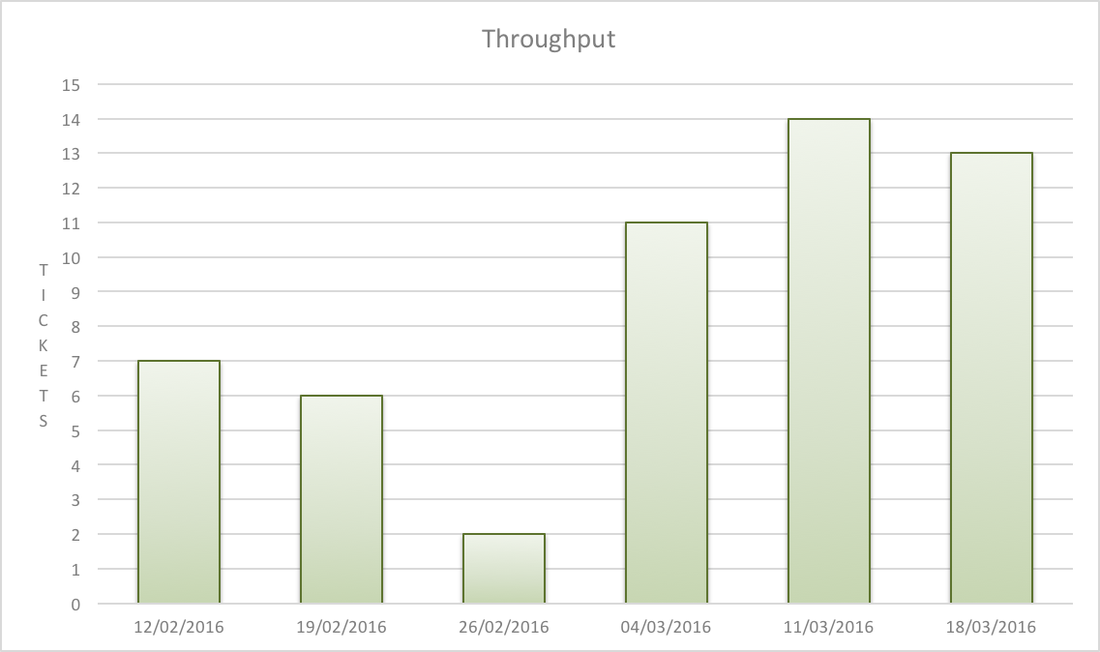 Once we got into March the team were managing work in progress again. We got more done and were benefiting from extra people in the team. Whereas at the end of February, more people had meant more in progress and we actually got less overall output!
1 Comment
In a previous post I talked about how effective limiting work in progress had been for one of the software delivery teams I worked with. The team’s discipline to stick to the limits didn’t come overnight, it was developed through experience and learning.
People tend to understand the logic of limiting work in progress on an individual basis. Once we get to a team or organisation, things are more complex. Like most things in life, limiting WIP has a benefit and a cost, it’s important to understand both in different scenarios. Here are some scenarios where I have seen teams call work in progress limits into question. The Urgent Bug The team stop to debate the limit rather than getting on with fixing the bug. The cost of temporarily exceeding the limit is low, while the cost of not fixing an urgent bug is high. This is a simple economic decision. Once you have decided urgent bugs can exceed the limit, it’s sensible to set a policy so that next time, the team just get on and fix it. If you are facing this frequently, there’s a high cost to exceeding the limit with too many bug fixes at once. Defining a class of service to handle urgent work with it’s own limit can allow you to manage this. Creating a separate horizontal lane, or ‘swim lane’ on the board is one way to help to manage urgent work that needs to be expedited. (We set our expedite limit to 1). Blockers If enough work becomes stuck, staying within the WIP limit stops the system. The limit appears to be slowing the team down, there is other available work they could be getting on with. However, the limit should force the team to stop and evaluate what’s going on. Why is so much work being blocked? If you can identify and permanently fix whatever is causing the problem, work will flow more smoothly from then on. You removed a source of delay, that delivers benefits for the delivery of every future work item. Furthermore, what about when blocked items become unblocked? If you ignored the limit, suddenly you have lots of context switching back to old work. You may have to remember what you were doing before it got blocked! If you can stick to the limits and fix the problems, the benefits of the limit should far outweigh the cost. Pushing rather than Pulling The MD needs something urgently. She goes directly to her favorite, most trusted developer. There’s a personal cost to the WIP limit, no one likes to say no, especially to senior people who they developed a relationship with. Teams would not be blamed for choosing to exceed the limit to not upset anyone. However, hopefully they recognise they exceeded the limit and have a conversation about how to handle this situation in future. Classes of service can help in a similar way to the urgent bug. You could measure lead times for that class of service and set a service level agreement with the MD, based on what the data tells you, giving the MD confidence and predictability. A Natural Bottleneck The team has 6 developers and 1 tester. The developers are getting through work quickly, then they hit the limit, as a queue of testing has formed. The team are stood around debating WIP limits again, surely they should just get on with starting the next piece of work? Starting more work won’t result in that work being delivered faster, the system is limited by the speed that work can be tested. Starting more work will just add to the test queue, slowing work down further, just like cars queuing at roadworks on a motorway, the more cars, the longer the queue. The limit is acting as a safety net stopping that from happening. The limit should force the team to stop, identify the bottleneck and find ways to alleviate it. Often when the team point the finger of blame at WIP limits, they are thinking about the local effects on them, rather than the economics of the system as a whole. It is said that the flutter of a butterfly's wing can ultimately cause a typhoon halfway around the world. In other words, a small change in a complex system can have dramatic effects. This is true of software delivery teams looking to improve flow, as I was reminded last year working with a new team and introducing just a few of the ideas popularised by Kanban and David Anderson. The team’s natural state was to pull in too much work, context switching and queues started to develop. We visualised this on a board and could see the queues and avatars spread across the work. The ability to see this presented the opportunity to talk about how to improve. We agreed to experiment with work in progress limits, starting by limiting the number of tickets to the number of developers that we had. We also talked about breaking down work further. The team were using relative sizing, so we agreed a maximum story point size, if a ticket was too big, we had to slice it up into smaller chunks. Lastly, we talked about context switching, and limited the number of avatars people were allowed to use. We captured all of these agreements next to our board, and validated the effects by looking at data before and after the change. The following chart was built by exporting data from our work tracking system into excel. We recorded where work was in progress and where it was queuing, and visualised it. The coloured areas represent the average time where work was taking place at the different stages in our workflow, the white space is the average time the work was queuing before each stage. This is then laid out in the order that those stages occur. This allows us to both calculate and visualise flow efficiency and show it in relation to cycle time, which is shown in days. 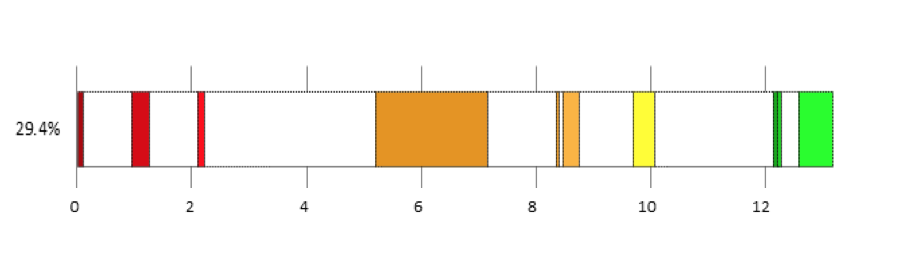 This is what it looked like the first time we measured it. Our flow efficiency was 29%, meaning 71% of the time a ticket was on the board, it was sat waiting in a queue. We could also see where work was spending the most time queuing. On Average, it was taking us about 13 days to get a ticket from initial analysis to live and delivering value. After the change, we saw some dramatic changes in the data. Cycle time to live had reduced from 13 days to just over 6 days. Our tickets were smaller, so you would expect cycle time to reduce, but the key is the increase in flow efficiency from 29% to 43%. The reason for this is reduction in queuing, which is clearly visualised in the chart. 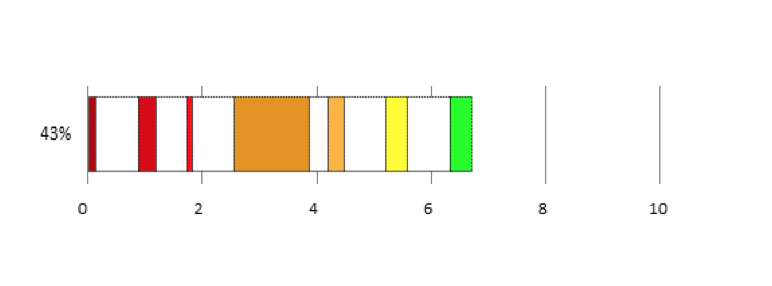 When we looked at this on a cumulative flow diagram, the effect of that increase was clear. The black area on the CFD is the count of tickets that we had got done and the coloured areas are the amount of work we had in progress at any time, the different colours representing a different stage in our workflow. 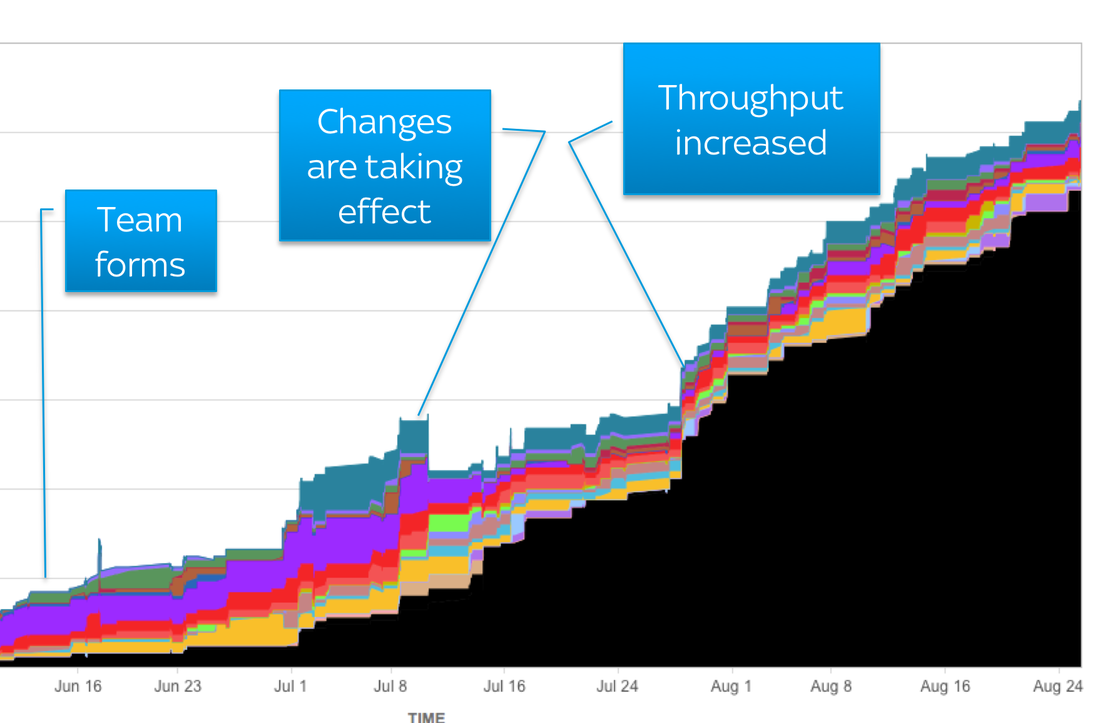 The changes we made did take a little while to take effect, as the tickets we already had in progress from before the change gradually made their way across the board to done, but eventually the effect becomes clear. When we measured throughput at the end of August, we could see that it had improved by roughly 150%, far more than a linear change that would have resulted from the reduction in the size of the tickets.
We started publishing these results around our office, pretty soon other teams were asking us what we did, and slowly the same principles began to cross pollinate around other teams. As we learned more, we tweaked the policies about WIP and ticket sizes, reducing them further. We introduced more ideas from Kanban, such as classes of service and understanding lead time distribution. All of this started from a short discussion about the way we work and agreement to try some changes. No one needed to work harder, no one needed to work over time, just some simple thoughts about how to improve our system put into practice. |
The Agile Apprentice
 RSS Feed